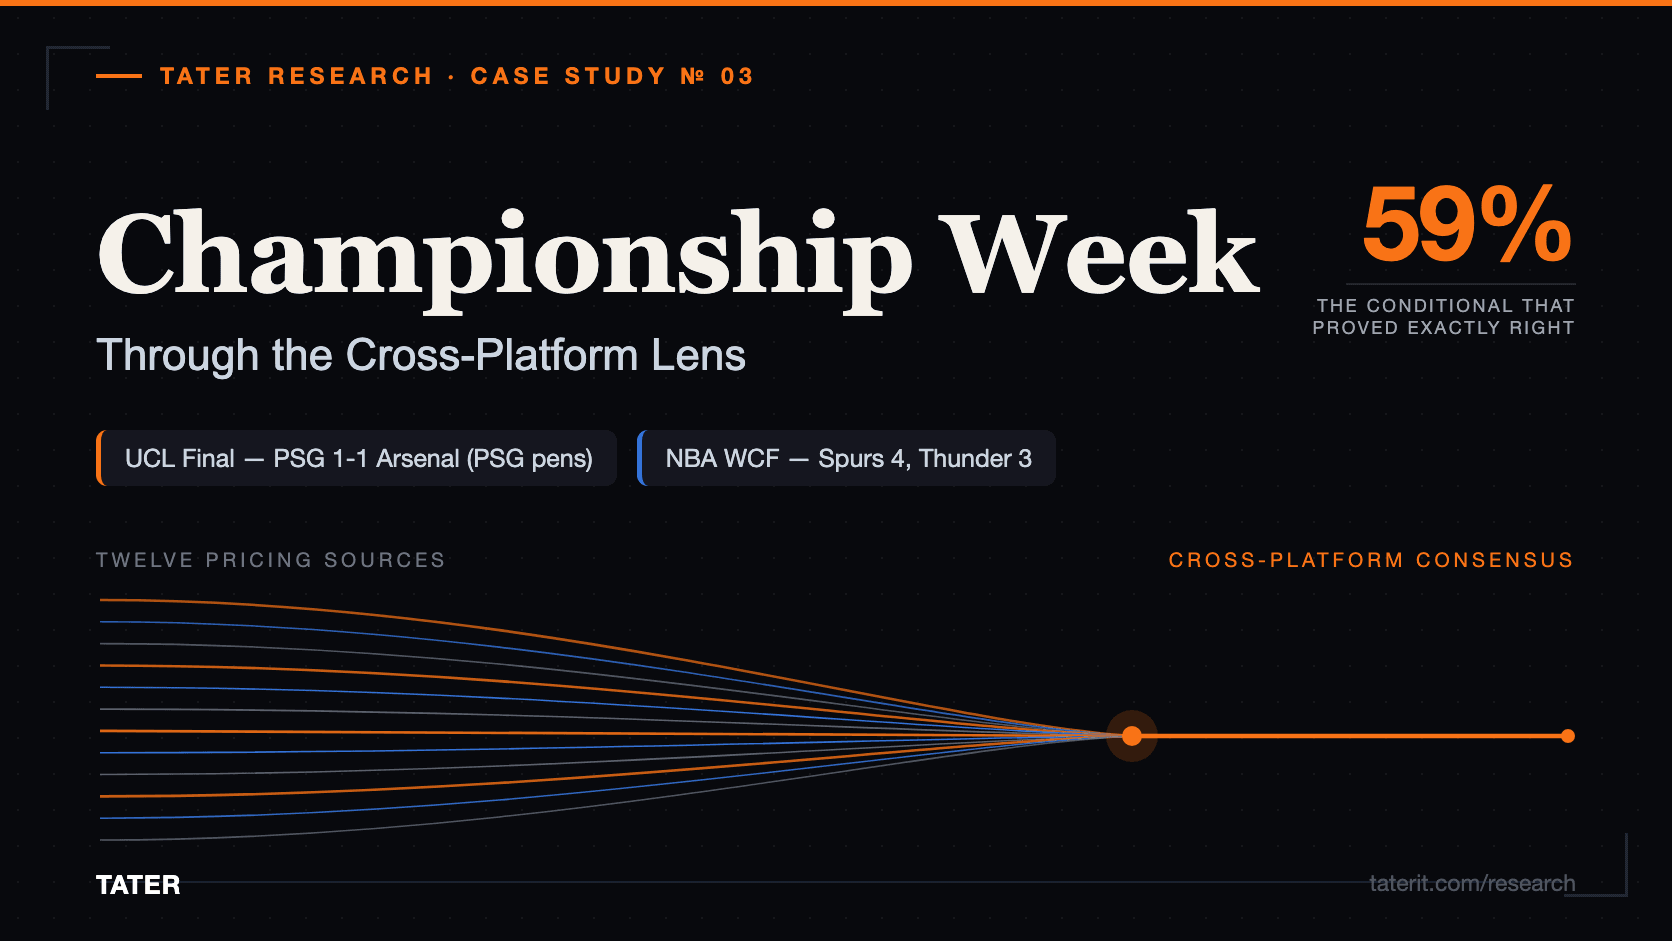
Championship Week Through the Cross-Platform Lens
Two championship events. Five days. Twelve pricing sources. What prediction markets and sportsbooks see differently.
- Author
- Tater Research
- Published
- Reading time
- ~12 min
- Event
- PSG 1, Arsenal 1 (PSG win 4-3 pens) · UCL Final · Budapest, 30 May 2026 | SAS 4, OKC 3 · NBA WCF · May 27-31, 2026
Two championship events. Five days. Twelve pricing sources. One question nobody else is asking: when prediction markets and sportsbooks look at the same event, do they see the same thing?
Last week delivered the two biggest events on the global sports calendar before the FIFA World Cup kicks off on June 11. The NBA Western Conference Finals went the distance with a Game 7 road upset. The UEFA Champions League Final went to extra time and penalties in Budapest. Between them, they generated hundreds of millions of dollars in trading volume across Polymarket, Kalshi, DraftKings, FanDuel, BetMGM, bet365, Pinnacle, and half a dozen other platforms.
We tracked all of them. Not one platform. All of them. Simultaneously. Pre-game, in-play, and post-resolution.
This is what the cross-platform data showed.
Part 1: The 59% That Proved Exactly Right
UEFA Champions League Final | PSG 1-1 Arsenal (AET), PSG win 4-3 on penalties
Puskás Aréna, Budapest | Saturday, May 30, 2026
Soccer finals are structurally different from any other sporting event in the betting world. The 90-minute result is a three-way market: Home Win, Draw, Away Win. But the trophy is a two-way market: one team lifts it. The gap between those two numbers contains a hidden probability that most casual bettors never see.
Here is what four platforms told us 8 hours before kickoff.
The Outright Market (Who Lifts the Trophy)
Prediction markets and sportsbooks were in rare agreement. PSG was the clear favorite at 56-58% across every platform. The cross-platform spread on the outright was just 1.7 percentage points across four pricing sources, from DraftKings (55.8%) to Polymarket (57.5%). For a Champions League Final, that is remarkably tight consensus.
PSG won on penalties. The favorite won. Four platforms agreed.
But the outright was not the interesting market.
The 3-Way Moneyline (90 Minutes Only)
The 90-minute market priced the draw at 29.2%. That is not a long shot. It is roughly one outcome in every 3.4 games. In Champions League finals specifically, the historical draw rate at 90 minutes is even higher: seven of the last fifteen finals went to extra time.
The draw hit. Havertz opened the scoring in the 6th minute for Arsenal. Dembélé equalized from the penalty spot in the 65th. The match ended 1-1. Extra time produced no winner. Penalties decided it.
Was the market wrong? No. The market priced three outcomes, and the second most likely one occurred. A 29% event happening is not a miss. It is the market working as designed.
The Hidden Number: 59%
Here is where the cross-platform view reveals something no single platform shows.
The gap between PSG’s 90-minute probability (39.7%) and their outright probability (56.9%) was 17.2 percentage points. That gap is not noise. It encodes a specific conditional probability: how likely PSG was to win if the match went past 90 minutes.
Outright = 90-min win + (Draw probability × P(win in ET/pens | drawn))
56.9% = 39.7% + 29.2% × 59.0%
The cross-platform consensus embedded a 59% conditional probability that PSG would win in extra time or penalties if the match was level after 90 minutes.
The match was level after 90 minutes. It went to penalties. PSG won 4-3.
That 59% was not published on any single platform’s interface. It was not in any pre-match pundit analysis we could find. It existed only in the gap between two markets, visible only when you put the outright and the 3-way side by side across platforms.
The Line Drift That Leaned Toward the Draw
Between our T-44h snapshot and the T-8h refresh, money moved away from a PSG regulation win and toward the draw and Arsenal. The drift was small but directionally correct. The draw price rose from 28.6% to 29.2% in the final 36 hours.
UCL Final Scorecard
UCL Final scorecard
Pre-game market read vs actual outcome across five markets.
| Market | Pre-game | Actual | Verdict | Result |
|---|---|---|---|---|
| 3-way ML | PSG 39.7% fav | Draw 1-1 | 29% outcome hit | ✗ |
| Total O/U 2.5 | Under 52% | 2 goals | Under correct | ✓ |
| Handicap -0.25 | PSG to cover | Draw | Push / half-loss | ✗ |
| Outright | PSG 56.9% | PSG (pens 4-3) | Favorite won | ✓ |
| ET / pens | PSG if ET 59% | PSG 4-3 pens | Spot on | ✓ |
The total goals market leaned Under at 52%. The match produced exactly 2 goals in regulation. Arsenal’s defensive structure held. The Under lean was correct and the margin was razor-thin.
Part 2: A Market That Learned in Real Time
NBA Western Conference Finals, Games 5-7 | OKC Thunder vs San Antonio Spurs
May 27-31, 2026
Three games in five days. The Thunder led the series 3-2 entering Game 5 as the No. 1 seed with home court advantage. The Spurs, led by Victor Wembanyama, were fighting elimination. What followed was a three-game sequence that tested every dimension of cross-platform market accuracy.
The Moneyline: 1 for 3
NBA WCF moneyline: Games 5-7
The market favored OKC in all three games. OKC won one.
| Market | Pre-game | Actual | Verdict | Result |
|---|---|---|---|---|
| Game 5 | OKC 60.5% fav | OKC 127-114 | Favorite won | ✓ |
| Game 6 | OKC 58% fav | SAS 118-91 | Upset — dog covered | ✗ |
| Game 7 | OKC 58% fav | SAS 111-103 | Upset — dog covered | ✗ |
The market picked OKC in all three games. OKC won one. The Spurs took the series.
But calling this a “market failure” misreads what probabilities mean. A 58% favorite loses 42% of the time. Over a three-game sample, at least one upset is expected.
The Total: A Market That Corrected Itself
Game 5: the market set the total at 217.5. The actual combined score was 241. A 23.5-point miss. The total market was nowhere close.
Game 6: the market recalibrated, moving up just one point to 218.5. The sportsbooks walked down from 219.5 to 218.5 in the final hours before tip, converging toward the prediction market line. The actual game produced 209 points. The total missed by 9.5, but in the other direction. The magnitude was shrinking.
Game 7: the market dropped the line to 212.5. The actual total: 214. Over by 1.5 points. Dead center.
Across three games, the total market miss went from 23.5 to 9.5 to 1.5. The market was learning the series in real time.
The “Quiet Edge”: PM Leading the Books
In Game 6, the prediction market line sat at 216.5, a full 3 points below the sportsbook opening of 219.5. Over the final hours before tip-off, the sportsbooks walked their line down to 218.5, narrowing the gap. The game landed at 209. The PM was closer.
The Williams Non-Move
Before Game 7, Jalen Williams was ruled out with a hamstring injury. Williams was OKC’s second-leading scorer in the series. His absence from a winner-take-all game should move the line.
The market did not move.
OKC remained a 58% home favorite. The spread stayed at -3.5. Why? Because Williams had been listed as questionable since Game 5 and missed Game 6 entirely. The market had already priced his absence. When the official “OUT” designation came, it contained no new information.
OKC then lost. But not because of Williams. SGA had 35. The offense did not collapse. The Spurs won because Julian Champagnie came off the bench and hit 6 of 10 three-pointers for 20 points. That is variance. A bench player shooting 60% from three in a Game 7 is not something any market can price.
The Series Price Arc
The 23.5-percentage-point drop after Game 6 (from 82% to 58.5%) was the single largest repricing event of the entire playoff series. One blowout loss on the road flipped the series from “OKC is nearly there” to “this is a coin flip.”
What the Data Tells Us
Outright and futures markets are well-calibrated across platforms. The UCL Final outright showed just 3.3pp of cross-platform spread. The NBA series price moved in lockstep across platforms. When the stakes are high and the market is liquid, platforms converge.
Game-level totals are the most volatile cross-platform product. The NBA total market missed by 23.5 points in Game 5. Totals are where pricing surfaces disagree most and where the cross-platform view adds the most value.
The conditional probability gap in soccer is an underexplored analytical tool. The 17.2pp gap between PSG’s 90-minute and outright probabilities encoded a 59% conditional that proved exactly right. Every soccer match with both a 3-way and an outright market contains this hidden number. For the World Cup, where draws are common in group stages and knockout rounds go to extra time and penalties, this conditional becomes one of the most important cross-platform metrics available.
Markets process information efficiently but not clairvoyantly. The Williams non-move, the total market self-correction, the draw drift in the UCL Final: these are examples of markets updating correctly on available information. The market did not predict Champagnie’s 6-for-10. What it did, across twelve platforms, was set prices that reflected the best available information at the time.
Prior Tater Research
This analysis builds on two earlier cross-platform studies. In May 2026, we documented how prediction markets repriced the Eurovision 2026 winner 25 minutes before the stage announcement, with Kalshi leading Polymarket by 49 seconds on the jury vote market. A week later, we tracked the EuroLeague Final, where Polymarket repriced a 50.5-percentage-point probability swing over 43 minutes during a fourth-quarter comeback while the sportsbook consensus lagged behind. The pattern across all four studies is consistent: prediction markets reprice faster on new information. Sportsbooks have deeper liquidity and tighter spreads on pre-game markets. The cross-platform view captures both.
Looking Ahead
FIFA World Cup 2026
The World Cup kicks off on June 11. 48 teams for the first time. Hosted across the United States, Mexico, and Canada. The first World Cup with legal US sports betting widely available at scale.
Every World Cup match is a three-way market with an outright sitting above it. The conditional probability gap we documented in the UCL Final exists in every single fixture. For group stage matches where a draw is a plausible and often strategically desirable outcome, the gap between 90-minute and advancement probabilities will be one of the most informative cross-platform metrics available.
Starting June 11, Tater Research will publish daily cross-platform market summaries for every World Cup match day. Pre-game consensus. Post-game scorecards. The conditional probabilities. The line drifts. The quiet edges.
Methodology
All implied probabilities have been adjusted to remove sportsbook vig using symmetric two-way normalization. Cross-platform comparisons use the de-vigged median across tracked books for the sportsbook consensus, the last-traded price for Polymarket, and the midpoint of yes-bid and yes-ask for Kalshi. Source data captured 27-31 May 2026 (NBA) and 29-30 May 2026 (UCL). Tracked books: DraftKings, FanDuel, BetMGM, bet365, Pinnacle, Bovada, BetOnline, BetRivers. NBA scores and statistics from NBA.com. UCL match data from UEFA.com.
About Tater
Tater is the discovery and comparison layer for prediction markets and sportsbooks. We aggregate real-time prices across 16 platforms, surface cross-platform edges, and help users find the best lines without holding accounts everywhere. Learn more at taterit.com.
Download the data
Sources: Polymarket, Kalshi, DraftKings, FanDuel, BetMGM, bet365, Pinnacle, Bovada, BetOnline, BetRivers. All probabilities de-vigged.
Subscribe to Tater Research
Get future publications in your inbox. No spam.